如下转载文章如有版权问题,请邮件联系bj92maker(at)163.com,我们将立即删除。
本文所介绍的工具适合家庭环境下的“黑盒测试”,它可以帮助你记录网络中发生的所有事情。你可以用它来检测网络威胁,或将数据提供给相关专家来进行网络取证分析。
如果你需要的是企业环境下的解决方案,你可以参考Security Onion的【这篇文章】。
购物清单
1. 树莓派3(外壳+电源+电路板)
2. 闪迪Class 10 microSD卡 64GB(80Mb/s)
3. Debian OS-Linux RaspbianLite
4. 网件千兆交换机或其他支持端口镜像的设备,我使用的是D-Link1100-08P
5. Critical Stack API(Threat Intel/ IOCs)
6. Mailgun账号或类似支持警报/通知的邮件服务
总价值:约75英镑
概览图

关键技术介绍
什么是端口镜像?
将一个端口的流量数据复制到另一个端口(被动式),会增加交换机的运行负荷。
什么是Bro?
一款IDS协议分析工具,你可以把它当作Wireshark的协议分析器,但是它没有GUI界面,而且速度更快。
什么是Netsniff?
进行数据包捕获的守护进程,它使用了AF-packet来提升数据包的捕捉速度。
什么是LOKI?
基于YARA的文件扫描守护进程。有些类似基于签名检测的反病毒产品,但是你可以自行制定检测规则。
什么是Critical Stack?
一个威胁情报平台,你可以在树莓派上通过API来与该平台链接。
什么是Team Cymru MHR?
一个恶意软件哈希库,你可以使用该数据库中的信息来对检测到的恶意程序哈希进行匹配。
开始动手
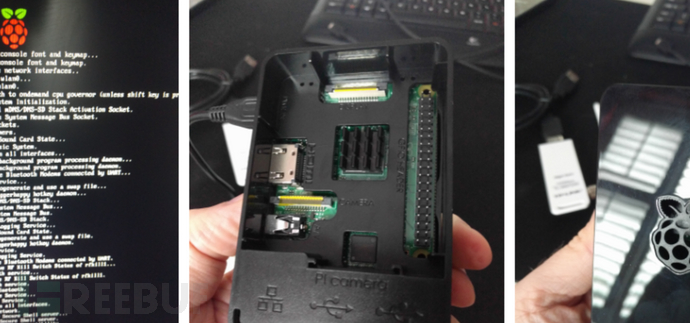
1. 把系统刷到树莓派中
2. 给树莓派分配一个IP
3. 运行bash脚本
4. 搞定
一、把Raspbian刷到microSD卡中
我使用的是MacBook,所以不同平台的方法可能会有所不同,其他平台用户可以参考【这篇教程】来获取更多内容。
插入microSD卡:
diskutil list
找到磁盘号:
diskutil unmountDisk /dev/disk
将Raspbian镜像刷入到microSD卡’disk’中:
sudo dd bs=1m if=image.imgof=/dev/rdisk
完成之后,卸载microSD卡:
diskutil unmountDisk /dev/disk 二、配置网络
使用默认配置登录。用户名:pi,密码:raspberry。
设置wlan0(wifi)的IP,用于受信管理访问:
sudo nano/etc/wpa_supplicant/wpa_supplicant.conf network={ ssid=”The_ESSID_from_earlier” psk=”Your_wifi_password” } sudo ifdown wlan0 sudo ifup wlan0 ifconfig wlan0
当你获取到了一个DHCP IP之后,你可以使用SSH访问这个节点了。接下来,将eth0留下当作镜像接口,它不需要设置IP地址。
sudo apt-get update && sudo apt-get-y install vim sudo vim /etc/network/interfaces
添加下列代码:
iface eth0 inet static static ip_address=0.0.0.0
重启eth0接口:
sudo ifconfig eth0 down && sudoifconfig eth0 up 三、部署
下载并运行bash脚本,脚本已在Raspbian上成功测试。
-安装程序的核心组件
-配置网络选项(禁用NIC offloading)
-给每一个程序创建服务
-使用Mailgun/SSMTP创建邮件警报
-配置cron任务
pi@foxhound:~# sudo su – root@foxhound:~# apt-get install -y git root@foxhound:~# cd ~ root@foxhound:~# git clonehttps://github.com/sneakymonk3y/foxhound-nsm.git root@foxhound:~# chmod +xfoxhound-nsm/foxhound.sh root@foxhound:~# ./foxhound-nsm/foxhound.sh
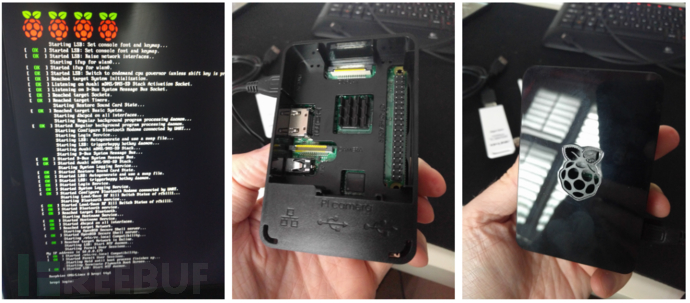
现在,环境部署已经完全完成啦!

接下来呢?当脚本完成运行之后,所有的服务都会被立刻激活,然后你就可以看到所有流入的数据啦!
性能
通过pcap数据来向镜像端口eth0发送一些垃圾信息,我使用的是一些提前准备好的数据:
pi@foxhound:~ $ sudo tcpreplay -t -K -q–loop=10 –intf1=eth0 /opt/foxhound-1476541443.pcap Actual: 1048570 packets (1050923190 bytes)sent in 87.62 seconds. Rated:11994102.0 bps, 91.51 Mbps, 11967.25 pps
下面是发送前和发送后的broctl netstats数据:
root@foxhound:/etc/network# broctl netstats bro: 1476547903.768150 recvd=1951368 dropped=5408 link=1956776 root@foxhound:/etc/network# broctl netstats bro: 1476548144.248161 recvd=3012168 dropped=14608 link=3026776
对于家庭或实验室环境来说,它的性能相对还算很好了(1000000个数据包只会丢弃10000个)。我的带宽速度为40Mbps,对于IDS系统来说已经足够了。如果你还需要提升性能,建议考虑换掉树莓派。
如果你想进行更多的NIC perf测试,你可以在服务器上运行下列命令:
mark@ubuntu:~$ sudo apt install iperf3 mark@ubuntu:~$ iperf3 -s ———————————————————– Serverlistening on 5201
然后在树莓派上运行:
root@foxhound:~# apt install iperf3 root@foxhound:~# iperf3 -c 10.0.0.7 -i 1 -t20 Connecting to host 10.0.0.7, port 5201 [ 4]local 10.0.0.180 port 38562 connected to 10.0.0.7 port 5201 [ ID] Interval Transfer Bandwidth Retr Cwnd [ 4] 0.00-1.00 sec 8.86 MBytes 74.3 Mbits/sec 0 89.1 KBytes … … … [ 4] 19.00-20.00 sec 9.26 MBytes 77.7 Mbits/sec 0 1.23 MBytes – – – – – – – – – – – – – – – – – – – – – — – – [ ID] Interval Transfer Bandwidth Retr [ 4] 0.00-20.00 sec 185 MBytes 77.5 Mbits/sec 139 sender [ 4] 0.00-20.00 sec 184 MBytes 77.1 Mbits/sec receiver iperf Done.
我假设这里的瓶颈是microSD卡,它的速度大约是80MB/s。
Bro基础
-所有Bro日志的默认存储路径为/nsm/bro/logs/
-默认的脚本路径为/usr/local/bro/share/bro/site/bro-s/
日志目录结构大致如下所示:
pi@foxhound:/nsm/bro/logs/current $ ls-lash total 6.9M 4.0K drwxr-xr-x 3 root root 4.0K Oct 15 16:11 . 4.0K drwxr-xr-x 5 root staff 4.0K Oct 1516:50 .. 4.0K -rw-r–r– 1 root root 349 Oct 15 16:51 app_stats.log 4.0K -rw-r–r– 1 root root 121 Oct 15 15:51 .cmdline 16K-rw-r–r– 1 root root 14K Oct 15 16:30communication.log 2.9M -rw-r–r– 1 root root 2.9M Oct 15 16:52 conn.log 16K-rw-r–r– 1 root root 14K Oct 15 16:52dhcp.log 384K -rw-r–r– 1 root root 379K Oct 15 16:52 dns.log 4.0K -rw-r–r– 1 root root 345 Oct 15 15:51 .env_vars 1.2M -rw-r–r– 1 root root 1.2M Oct 15 16:52 files.log 1.6M -rw-r–r– 1 root root 1.6M Oct 15 16:52 http.log 4.0K -rw-r–r– 1 root root 291 Oct 15 16:44 known_hosts.log 4.0K -rw-r–r– 1 root root 327 Oct 15 16:34 known_services.log 12K-rw-r–r– 1 root root 11K Oct 15 16:50notice.log 4.0K -rw-r–r– 1 root root 5 Oct 15 15:51 .pid 4.0K -rw-r–r– 1 root root 18 Oct 15 16:00 .rotated.communication 4.0K -rw-r–r– 1 root root 18 Oct 15 16:00 .rotated.conn 4.0K -rw-r–r– 1 root root 18 Oct 15 16:01 .rotated.conn-summary 4.0K -rw-r–r– 1 root root 18 Oct 15 16:00 .rotated.dhcp 4.0K -rw-r–r– 1 root root 18 Oct 15 16:00 .rotated.dns 4.0K -rw-r–r– 1 root root 18 Oct 15 16:00 .rotated.files 4.0K -rw-r–r– 1 root root 18 Oct 15 16:00 .rotated.http 4.0K -rw-r–r– 1 root root 18 Oct 15 16:00 .rotated.known_hosts 4.0K -rw-r–r– 1 root root 18 Oct 15 16:00 .rotated.known_services 4.0K -rw-r–r– 1 root root 18 Oct 15 16:00 .rotated.loaded_s 4.0K -rw-r–r– 1 root root 18 Oct 15 16:00 .rotated.notice 4.0K -rw-r–r– 1 root root 18 Oct 15 16:00 .rotated.packet_filter 4.0K -rw-r–r– 1 root root 18 Oct 15 16:00 .rotated.software 4.0K -rw-r–r– 1 root root 18 Oct 15 16:00 .rotated.ssl 4.0K -rw-r–r– 1 root root 18 Oct 15 16:00 .rotated.weird 4.0K -rw-r–r– 1 root root 18 Oct 15 16:00 .rotated.x509 4.0K -rw-r–r– 1 root root 3.0K Oct 15 16:51 software.log 320K -rw-r–r– 1 root root 314K Oct 15 16:52 ssl.log 4.0K -rw-r–r– 1 root root 58 Oct 15 15:51 .startup 4.0K drwx—— 3 root root 4.0K Oct 15 15:51 .state 4.0K -rwx—— 1 root root 18 Oct 15 15:51 .status 4.0K -rw-r–r– 1 root root 46Oct 15 15:51 stderr.log 4.0K -rw-r–r– 1 root root 188 Oct 15 15:51 stdout.log 24K-rw-r–r– 1 root root 17K Oct 15 16:52weird.log 416K -rw-r–r– 1 root root 412K Oct 15 16:52 x509.log
你可以使用head命令来查找文本域名称:
pi@foxhound:$ head dns.log #separator \x09 #set_separator , #empty_field (empty) #unset_field – #path dns #open 2016-10-15-16-00-01 #fields ts uid id.orig_h id.orig_p id.resp_h id.resp_p proto trans_id query qclass qclass_name qtype qtype_name rcode rcode_name AA TC RD RA Z answers TTLs rejected #types time string addr port addr port enum count string count string count string count string bool bool bool bool count vector[string] vector[interval] bool
使用bro-cut来解析日志:
pi@foxhound:$ cat dns.log | bro-cut -D tsid.orig_h id.orig_p id.resp_h id.resp_p proto query answers TTLs
基础报告:
pi@foxhound:$ bro-cut query < dns.log |sort | uniq -c | sort -rn | head -n 10
如果你还需要更多的示例,你可以查看Bro提供的官方练习【传送门】。
你可以使用tail命令输出DNS日志并在客户端生成一些DNS流量:
tail -f dns.log | awk ‘{print $3, $7, $9}’
请注意,只有conn.log才可以启用MaxMind GEOIP查询。
pi@foxhound:$ bro-cut resp_cc < conn.log| sort | uniq -c | sort -rn | head -n 10 755 US 524 RO 123 GB 49 NL 28 EU 25 IE 10 DE 7 ES 6 CA
我还没有制作仪表盘(Dashboard),如果你不想自己做的话,你可以直接使用VPS ELK实例在云端存储所有的日志,或者你也可以使用ELK/Splunk/Graylog将日志存储在本地。
基础维护
开启/停止netsniff-ng:
pi@foxhound:~ $ sudo service netsniff-ngstop pi@foxhound:~ $ sudo service netsniff-ngstart pi@foxhound:~ $ sudo service netsniff-ngstatus
开启/停止bro(网络统计):
pi@foxhound:~ $ sudo -i broctl stop pi@foxhound:~ $ sudo -i broctl start pi@foxhound:~ $ sudo -i broctl netstats pi@foxhound:~ $ sudo -i broctl status
手动运行Loki:
root@foxhound:~ $ python /nsm/Loki/loki.py–noprocscan –dontwait –onlyrelevant -p /nsm/bro/extracted -l /nsm/Loki/log
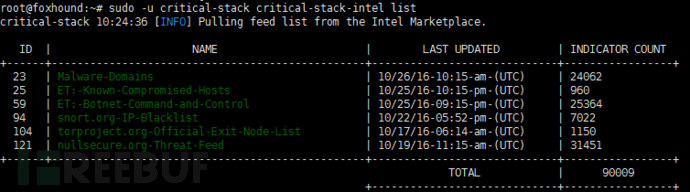
检测CriticalStack的入侵威胁指标(IoCs),可通过cron脚本实现定期检查:
root@foxhound:~ $ sudo -u critical-stackcritical-stack-intel list
参考资料
1. 部署网络安全监控:http://www.appliednsm.com/
2. 网络安全监控实践:https://www.nostarch.com/nsm
3. Laika BOSS-对象扫描系统:https://github.com/lmco/laikaboss
4. PassiveDNS:https://github.com/gamelinux/passivedns
5. D3js(图形化工具):https://d3js.org/
6. Graylog:https://www.graylog.org/

* 参考来源:sneakymonkey,FB小编Alpha_h4ck编译,转载请注明来自FreeBuf.COM